 Instructors: Kelly Kaufhold, Ph.D. and Daniel Carter, Ph.D.
Week of April 9
Description
Telling stories with data isn’t new – the Guardian, in London, used data to report on the cost of education and the New York Tribune used academic data to document a big increase in cholera in 1849. But there have been two substantial changes in data, for journalists and academics:
1) Access to data – incredible amounts of it;
2) Tools to analyze, interpret and share data findings.
The Web and mobile technologies not only make us consumers of data – they also make us contributors to it.
Read and Watch
The Tow Center for Digital Journalism at Columbia University has been a leader in the practice and context of data journalism since it was founded in 2010. This online text, The Art and Science of Data-Driven Journalism is a nice primer on what has changed in this area since Web 2.0 brought interactivity to online communication 20 years ago; and especially since the advent of mobile a decade ago.
Pay special attention to:
- Chapter III. Why Data Journalism Matters;
- Chapter VI. Tools of the Trade, and;
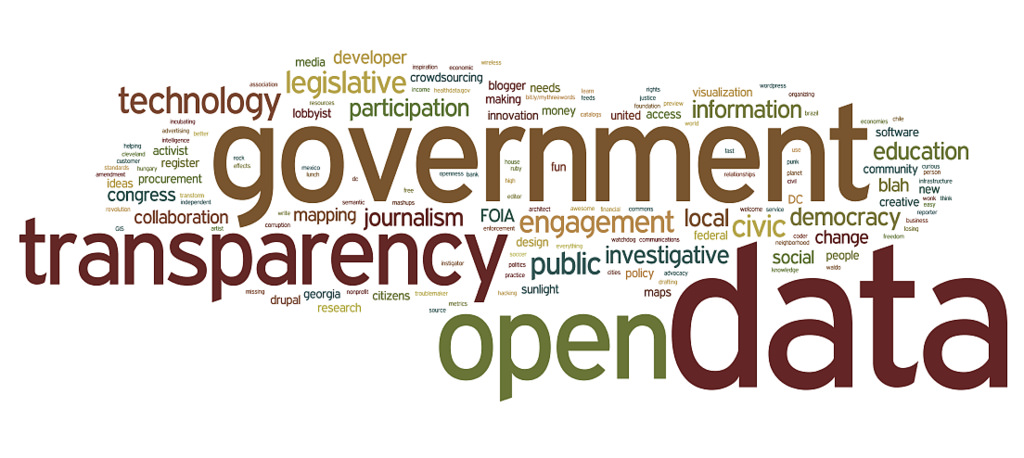
- Chapter VII. Open Government
There’s a nice section in Chapter V. Pathways to the Profession about journalism education, including this, from Aron Pilhofer, Steele Chair in Journalism Education at Temple University in Philadelphia and former executive editor of digital at The Guardian and associate managing editor for digital strategy at the New York Times:
“Journalism programs need to step up and understand that we live in a data-rich society, and math skills and basic data analysis skills are highly relevant to journalism… Journalism is one of the few professions that not only tolerates general innumeracy, but celebrates it. I still hear journalists who are proud of it, even celebrating that they can’t do math, even though programming is about logic. It’s hard to get a journalist to open up a spreadsheet, much less open up a command line… It’s baffling to me. Look at the Sun-Sentinel, which just won another Pulitzer for a story on speeding cops that you could only do with data analysis.”
One main takeaway is the inherent tension between opportunities and challenges with digital media and data:
- We all have copious access to more information sources than ever, but fewer media outlets make money;
- And we enjoy a wealth of free, open data as scholars, while also providing much of that data through our online, mobile and social media behavior…not all of it willingly.
Also, take a look at Clarifying Journalism’s Quantitative Turn: A typology for evaluating data journalism, computational journalism, and computer-assisted reporting, by Mark Coddington
Data Journalism and Visualization Projects
There are many excellent examples of data journalism and visualization projects. Here are just a few.
- Hell and High Water, ProPublica and Texas Tribune
- Dollars for Docs, ProPublica
- Gun Deaths in America, FiveThirtyEight
- Mixed Signs, Fatal Consequences, Austin American-Statesman
- Fenced Out, Washington Post
- Texas Public Schools Explorer, Texas Tribune
- The Rhymes Behind Hamilton, Wall Street Journal
- Music Timeline, Google
We’ll show you how to search for, find, analyze and interpret data on campus in May (and how to teach those things) and also expose you to how data has transformed digital media research in the Digital Scholarship module.
Discussion Assignment:
For this week, we’ll join a conversation on Slack with you this week in #datajournalism about these questions:
- What are some of the tensions created by the availability/use/ubiquity/openness/secrecy of data in news (and in society where it intersects with news, like the current Facebook/Cambridge Analytica saga);
- How might you measure or study that? Where might you find relevant data?
- What are your favorite data projects?
- What questions do you have about Data Journalism?
Also, if you haven’t already, please provide feedback in the Mid-Workshop Evaluation. This will help us as we tweak the curriculum for the in-person session.