Instructor: Cindy Royal
Friday, July 17, 3pm
Description
In this module, you will learn more about programming concepts and apply them in a hands-on exercise.
Outline
I. Overview of HTML/CSS/Bootstrap Concepts
II. Intro to Programming
III. DOM Manipulation
IV. Quiz Exercise
V. Google Charts Exercise
Before the Zoom
We will be using a variety of HTML form elements to create a quiz that will provide a score to the user.
- Find the PhDigital Exercises Project on Glitch and Remix it to your own Account before our Zoom session. The index.html page is the Quiz page. There is a css page that includes a few styles to control the look of the page that will be applied to both pages we work on today. We will use the chart.html file for the 2nd exercise. Have your Glitch account open to this project and have this tutorial open for the Zoom on Friday, July 17 at 3pm CT (4pm ET, 1pm PT). Check your email for Zoom details.
- Review the materials from the Web Development and Mobile Concepts module, particularly the video on JavaScript Concepts and the link to the Glitch with the Interactive JavaScript Examples.
During the Session
Forms
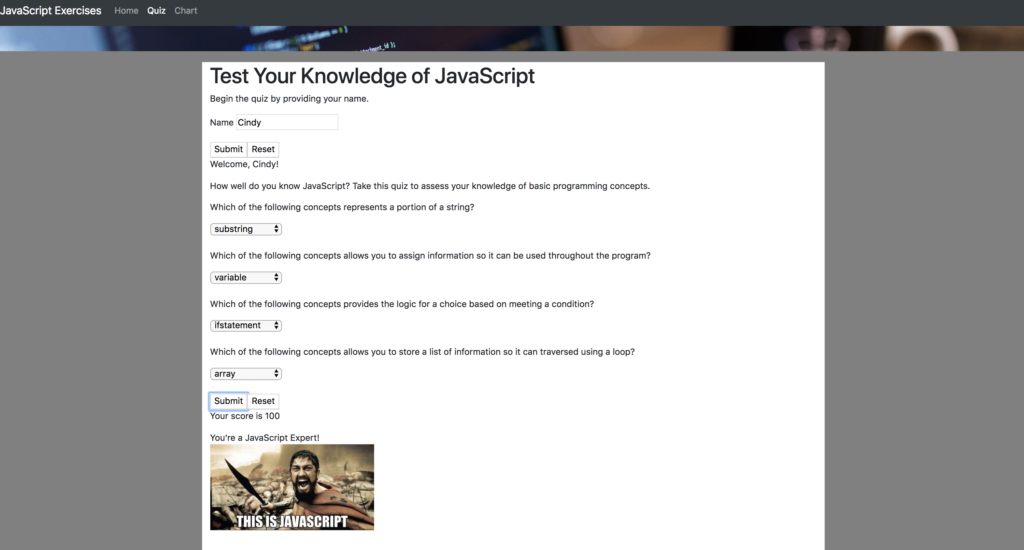
There are two forms on the index.html (quiz) page. One is a simple form that asks the user’s name. We can use this name in other places in the Quiz to personalize the results.
The first form, form1, has an opening and closing form element, a label and an input of type text. An id of “yourname” has been established to identify the user’s input. I put this in a <p> tag to format it, but you can use any elements or styles to contain these elements. A button with type ‘submit’ is used to Submit the form. Once the value has been captured, it can be used in the page.
DOM Manipulation
The Document Object Model is a representation of the structure and content of the page. To manipulate an element in the DOM, you need a DOM element in which to send the result. Below the form, you will see an empty paragraph with an id of “name”. This will not be visible until the user submits the form. However, if you wanted to start with text in this paragraph, it will be replaced when the form is executed via the script below.
<p id="name"></p>Script
Let’s create the script for form1, capturing the user’s name and responding. Below the html items, find the script element to include our JavaScript. JavaScript works natively in modern browsers without any additional links or plugins required. Include this code within the script element already provided (don’t repeat the opening and closing script tags).
<script>
document.getElementById("form1").onsubmit=function() {
yrname = document.getElementById("yourname").value;
document.getElementById("name").innerHTML = "Welcome, " + yrname + "!" ;

return false;
}

</script>
The first line provides the code for the event on which the script is executed, in this case the “onsubmit” event. We have created a generic function that gets the value of “yourname”, assigns to a variable named “yrname” and then manipulates the DOM element of “name” with some text concatenated with the “yrname” variable.
The return false; is required to prevent the Submit functions default behavior of refreshing the page. We simply want to manipulate an element on the page. This is not necessary for other types of events.
- Try it and submit the form with your name. If you have problems, use the Chrome Inspector Console to see if it can help you troubleshoot. The Console will often highlight if there is a syntax problem, indicating the row number.
- Change some of the text that is concatenated with the variable in the code and try it again.
Congratulations! You have performed a DOM manipulation.
Show/Hide a Div
Notice that we have a paragraph in a div with an id of “quiz.” By doing so, we can manipulate the DOM to hide the quiz, until the user inputs her name.
<div id="quiz">
<p>How well do you know JavaScript? Take this quiz to assess your knowledge of basic programming concepts.</p>
...Rest of quiz
</div>
At the top of the page, find the <style> section. For this element, we want to initially have the quiz hidden with CSS. Include this in the style area.
#quiz {
display: none;
}
Refresh the page again and that the “quiz” div is now hidden.
Let’s add a line of code to the form1 function to have it appear when that code is executed. Put this above the return false; statement.
document.getElementById("quiz").style.display = "block";This code changes the display style from none to block, so it is now showing. Refresh the page to be sure it is working.
Coding the Quiz
Look at the html. We are giving each answer its own id (q1, q2, q3, q4), to assign the value provided to a variable. Notice that each select grouping has values assigned to each option. The correct answer gets 25 points, incorrect gets 0. Since there are four questions, 25 x 4 = 100!
There are also two DOM elements after the form is closed. They will be used to hold our results.
Scripting the Quiz
In your scripting area, below where we have been previously working, include this code for form2. This is a separate function for form2.
document.getElementById("form2").onsubmit=function() {
total = 0;
q1 = parseInt(document.getElementById("q1").value);
q2 = parseInt(document.getElementById("q2").value);
q3 = parseInt(document.getElementById("q3").value);
q4 = parseInt(document.getElementById("q4").value);

total = q1 + q2 + q3 + q4;

document.getElementById("score").innerHTML = "Your score is " + total ;

return false;
}
Let’s look at what is happening in the code. In this area, we are initializing a variable named “total” at 0, so it resets every time the form in submitted. We get the values from each select grouping, but they need to be understood as integers, thus the parseInt statement. A total is calculated. And a score is provided in the total DOM element when the form is submitted.
Check your project in Glitch. If you have problems, use the Chrome Inspector Console (ctrl-click on page and select Inspect from context menu and choose Console) or look for errors in the code on Glitch to see if it can help you troubleshoot.
- Can you concatenate the user’s name into the score?
Adding a Response using JSON
JSON or JavaScript Object Notation is a way to store data in a text format on the web. It is an array of objects, holding key/value pairs. You can use a loop to traverse the JSON to filter the data to a specific request. In this case, we are going to use the score and compare it to a value in the JSON to provide a response to the user, as well as a meme. The images are already available in the img folder in the Bootstrap installation.
Grab the following data and include in the form2 function, above the return false; statement. Notice that we are using the Glitch method for referencing images. If you were doing this on your computer or another web server, use the direct reference to your images.
feedback = [
{total: 0, response: "Did you study", img: "https://cdn.glitch.com/f0f84923-8ace-481f-b000-bbba7c56fe22%2Fnone.jpg?v=1594132742677"},
{total: 25, response: "Could have done better", img: "https://cdn.glitch.com/f0f84923-8ace-481f-b000-bbba7c56fe22%2Fpoor.jpg?v=1594132748137"},
{total: 50, response: "Keep trying", img: "https://cdn.glitch.com/f0f84923-8ace-481f-b000-bbba7c56fe22%2Fbelow.jpg?v=1594132732712"},
{total: 75, response: "Almost there", img: "https://cdn.glitch.com/f0f84923-8ace-481f-b000-bbba7c56fe22%2Faverage.jpg?v=1594132727834"},
{total: 100, response: "You're a JavaScript Expert!", img: "https://cdn.glitch.com/f0f84923-8ace-481f-b000-bbba7c56fe22%2Fexcellent.jpg?v=1594132737597"},

];

for(i=0;i<feedback.length; i++) {
if(total == feedback[i].total){
document.getElementById("answer").innerHTML = feedback[i].response + "<br><img src=" + feedback[i].img + " width=400 />" ;
}
}
Notice the for loop that uses the iterator “i” to traverse each item in the JSON. Using the if statement, when it finds a match with the value of score, it provides the response. And if you have the images, it provides the meme image and establishes a width, concatenating html into the answer.
Try the project again in Glitch. You should be able to take the quiz and see the response and image based on your score. If you have problems, use the Chrome Inspector Console to see if it can help you troubleshoot or see if the Glitch code has any errors.
All of these items can be adjusted for your own purposes and layout.
Exercise:
- Make sure you have a working quiz with the code provided above. If you have problems, use the Chrome Inspector Console or the Glitch code hints to see if it can help you troubleshoot.
- Concatenate the user’s name into the responses somehow, as you did with the score.
- Add a question to this quiz (see the html below. What do you need to change to make it work with 5 questions? Consider the question’s unique id, the point values, the way the value is assigned and added to total, and how the json works to report the result. Create another response and find another image (save it in the image folder) to represent a new score value.
<p>In coding, JSON stands for:</p>
<select id="q5">
<option value="0">Choose:</option>
<option value="0">JavaScript Open Notation</option>
<option value="0">Just Script On Node</option>
<option value="0">JavaScript Object Notation</option>
<option value="0">JavaScript Only Notes</option>
</select>
Congrats! You have created a functioning interactive quiz that provides responses to a user based on her answers! Our next module will look at making interactive charts. You’ll notice now the the link from the index.html page for the quiz will open this quiz. You are starting to make a news application.
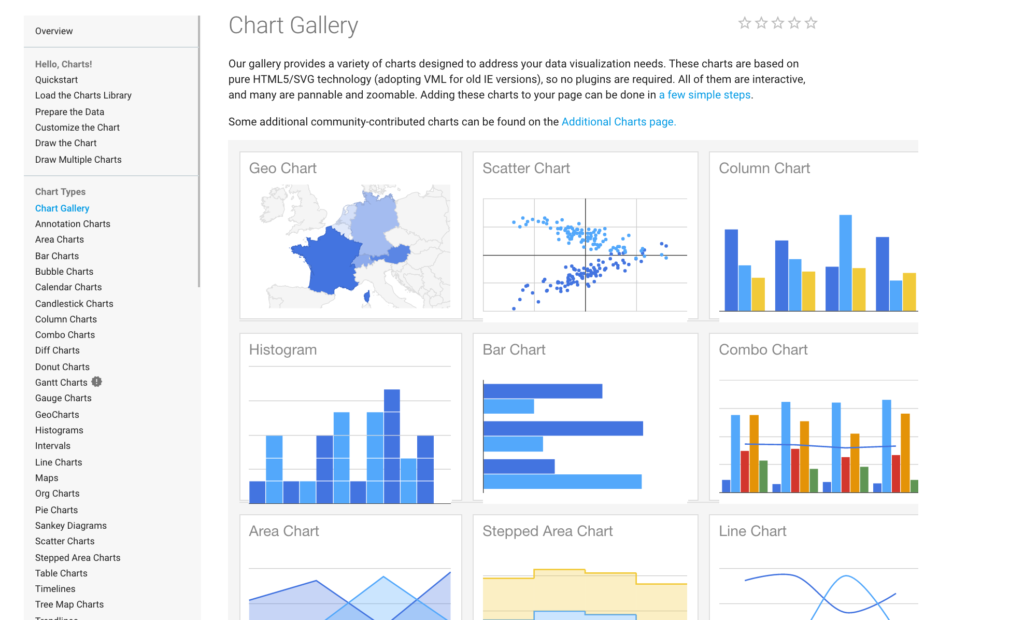
Google Charts Exercise
The Google Charts API provides code that you can use, with your knowledge of JavaScript, to make interactive charts. Look through the extensive Google Chart Gallery for ideas about charts you’d might be able to use. We’ll be working with the pie and column charts.
Each chart needs the following code in the head of the document to connect to the Google Charts API. Let’s put this code in a file named chart.html. Use the index.html page as a template and Save As, chart.html. Notice that this code is included in the head section.
<script type="text/javascript" src="https://www.gstatic.com/charts/loader.js"></script>In addition, the code will need to know what charting package to use. Pie, bar, column an and line charts are all part of the “core” package. Maps are part of the “map” package. This is included where needed in the code samples below.
google.charts.load('current', {'packages':['corechart']});We also need to use the following code to indicate what happens when the page loads, which function should be called on load. Typically, a version of the chart is drawn when page loads, so that something is visible. However, if you don’t want anything visible on load, this line can be eliminated. This is included where needed in the code samples below.
google.charts.setOnLoadCallback(drawChart);Then you create the function that draws the chart. In these examples, the function is named drawChart(), but you can name it anything you want as long as that is how you call it. You call it in the form HTML with an appropriate event. For example:
<form id="form1" onsubmit="drawChart(); return false" >Within the function, you use JavaScript to get the values from the form into your variables, either from direct input or via JSON. The arrayToDataTable includes the elements and variable names. The code ends with the declarations to create and draw the charts to the appropriate DOM element.
var chart = new google.visualization.PieChart(document.getElementById('piechart'));chart.draw(data, options);The examples below provide working code for various types of charts.
Pie Chart with JSON Data
Google Charts can be used with JavaScript to pass values into charts based on user input. Instead of using values in the code, you will create a series of variables. This example shows how to get a user’s input from a form and have it create a Pie Chart. When the user submits the form, the inputs are converted to variables and the values associated with those variables populate the chart.
The style section of the page includes the following code. This identifies the height of the chart. It can be adjusted to your liking. And you can use any other styles to control your page, but we’ll just go with this for now.
<style>
    #yourchart {
    height: 400px;
    }
</style>
Included in the html section is the following code. This creates a form named “form1”, creates an onchange event to all the function to draw the chart (will be defined below) and creates a dropdown with an id of “thedropdown” to get the user’s selection. It creates a div with the id “yourchart” where the chart will be drawn.
<form id="form1" name="form1" onchange="drawChart()" >
     <select id="thedropdown">
     <option value="male">Male</option>
     <option value="female">Female</option>
     </select>
  </form>

  <div id="yourchart"></div>
Include the script below the html in the file. This will define the chart and read data from a JSON section into it. JSON stands for JavaScript Object Notation and is a convenient format for storing data using key-value pairs. Comments in the code describe what each section is doing.
<script>
//these are required to establish the chart package and determine which function to call when the page loads
      google.charts.load('current', {'packages':['corechart']});
      google.charts.setOnLoadCallback(drawChart);

// this is the json area that includes the data that will be read into the chart
info = [{gender: "male", work: 40, eat: 14, commute: 5, entertainment: 10, sleep: 40, housework: 10, other: 49},
     {gender: "female", work: 45, eat: 10, commute: 7, entertainment: 5, sleep: 50, housework: 25, other: 26 }
     ];

// this is the function that draws the chart
function drawChart() {
    // gets the value of the dropdown
    mygender = document.getElementById("thedropdown").value;

//for loop reads through the data, finds a match with the dropdown value and populates the variables with the data for that value.
    for(i=0; i<info.length; i++) {
    if(mygender == info[i].gender) {
       work = info[i].work;
       eat = info[i].eat;
       commute = info[i].commute;
       entertainment = info[i].entertainment;
       sleep = info[i].sleep;
       housework = info[i].housework;
       other = info[i].other;
    }// end if
    } // end for

//reads the data into the chart
    var data = google.visualization.arrayToDataTable([
          ['Task', 'Hours per Week'],
          ['Work',     work],
          ['Eat',      eat],
          ['Commute',  commute],
          ['Entertainment', entertainment],
          ['Sleep',    sleep],
          ['Housework',    housework],
          ['Other',    other]
        ]);
        var options = {
          title: 'Weekly Activities',
          colors: ['orange','#00cc33', 'pink', 'yellow','lightblue', 'purple', 'blue'],
        };

//creates the new chart and identifies which element to place it
        var chart = new google.visualization.PieChart(document.getElementById('yourchart'));
// draws the chart with the data and options provided.
     chart.draw(data, options);
      }
    </script>
Change to Column Chart
Change the type of chart in the visualization statement to a ColumnChart. Pie, Bar, Line and Column Charts are in the same core package, so all you have to change is the chart type. How does your chart change? You may want to remove the legend and set min and max values for this Column Chart. Add the code below to the Options section. Make sure each line is separated by a comma. Full detail on how to customize the code for each chart type is found on the Google Chart Gallery.
legend: 'none',
vAxis: { viewWindow: { min: 0, max: 50 }},
These Google Charts are responsive. Size the window and refresh the browser. They don’t size along with the browser, but on a smaller device, they will come up appropriately in the window.
Now your application has a chart.html page. You can add content throughout the site to make this a complete news application with quiz and chart! Navigate through your project, make sure everything works as intended and troubleshoot any issues.
Try It with New Data
Let’s try one with some different data on your own. Below is some data I derived from the New York Times github to determine new Covid cases by month for the top six states. You can decide if you want to use this data to have the dropdown be either the State or the Month (Hint: It is easier with this data set to have the State as the dropdown). Choose an appropriate chart type in the visualization statement and make any other necessary adjustments to the chart. You can just change the chart on the page you have been working. Carefully think through what needs to be changed on the chart to accommodate this data.
When you are done, submit the Glitch url for your project to the #charts Slack channel.
info = [
 {   State: "New York",   Jan: 0,   Feb: 0,   Mar: 76211,   Apr: 233485,   May: 65879,   Jun: 22567 },
 {   State: "California",   Jan: 3,   Feb: 25,   Mar: 8555,   Apr: 41887,   May: 62644,   Jun: 119039 },
 {   State: "Texas",   Jan: 0,   Feb: 11,   Mar: 3577,   Apr: 25484,   May: 35902,   Jun: 101729 },
 {   State: "Florida",   Jan: 0,   Feb: 0,   Mar: 6742,   Apr: 26941,   May: 22472,   Jun: 96271 },
 {   State: "New Jersey",   Jan: 0,   Feb: 0,   Mar: 18696,   Apr: 99956,   May: 41793,   Jun: 13076 },
 {   State: "Illinois",   Jan: 2,   Feb: 1,   Mar: 5989,   Apr: 46926,   May: 67670,   Jun: 24073 }
];
Final Note: Of course, in order for others on the web to see your projects, your files must be hosted on a web server. Glitch is a good site for practicing, but it is not meant for a permanent site (and it sometimes has performance issues). Generally, you would contract with a web host (Reclaim Hosting is a good host for students, but there are many web hosts from which to choose), get access to a domain and use an ftp program (file transfer protocol) to place a copy of your files on the server. Then they are available for the world to view. Using folders and subdomains allows you to organize your work and host multiple projects on a single domain.
Coding Resources
- HTML & CSS: Design and Build Websites book by Jon Duckett
- JavaScript and JQuery: Interactive Front-End Web Development book by Jon Duckett
- Mozilla Developer Network HTML Reference
- Mozilla Developer Network CSS Reference
- CodeActually.com – this is my own site where I host code samples and projects
- Codecademy – great learn-to-code resource.
- If your university provides access to Lynda.com (which is now LinkedIn Learning), this is also a good resource that provides access to thousands of video lessons and tutorials. It does provide a free month and after that you can renew on a monthly or annual basis.
- Glitch – Glitch is a useful resource and active community for anyone coding. It is an environment of projects that provides code samples. You can host projects on it. You can also set up and share projects so that students can code together in class. Learn more about Glitch on this post What Is Glitch?
- Stack Overflow – I find the answers to most of my coding problems on Stack Overflow. However, I usually land there from a Google search of my problem.
- GitHub – GitHub is like a social network for code. Developers share projects and code on this site.
- Google Charts Exercise – CodeActually.com – additional exercises using the Google Charts API can be found on this link, including Maps and GeoCharts, with additional exercises and suggestions for including Multiple Charts on a page.
- Filtering Data Exercise – CodeActually.com exercise that demonstrates how to loop over json data and present in a table.