 Instructor: Cindy Royal
Description
In this module, you will apply JavaScript to code in a data visualization package. This exercise uses Plotly.js, but you can use other packages (like the Google Charts API. Examples on CodeActually). Find code samples on these sites and modify with your own data and exercises.
To use the Plotly.js api, the following statement must be included in the head of the document to link to the api and code library.
<script src="https://cdn.plot.ly/plotly-latest.min.js"></script>
Sample Code for Interactive Data Visualization Exercise
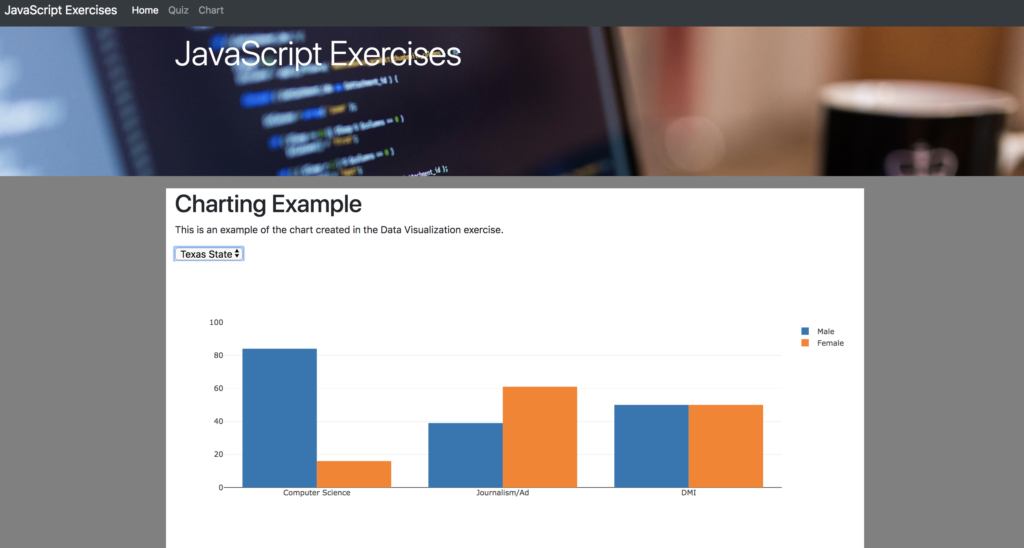
For this exercise, we will be creating a grouped bar chart that shows enrollment percentages for some academic programs.
If you look at the sample code for a Plotly.js grouped bar chart, you will see that they provide an example that has the data encoded in the trace sections. See the lines with the y data. You can see an example of how the chart works on that page.
However, we’d like to create an interactive chart that changes with a dropdown. Open the original index.html file that is in the Bootstrap package. Rename it chart.html. Include the plotly.js script link in the head of the document, as indicated above.
In the main content div on the page (see class=”col-sm”), create a form and DOM element. Notice I have included an onchange event in the form that will call the drawChart function that we will create below.
<form id="form1" onchange="drawChart()">
<select id="thedropdown">
<option value="txst">Texas State</option>
<option value="ut">UT</option>
</select>
</form>

<div id="myDiv"><!-- Plotly chart will be drawn inside this DIV --></div>
Next, in the script area, include the data you want to use. I have formatted this set of data into a JSON file. If you have your own data, you will have to work on analyzing it to get it into a format you can use to visualize it. This data shows male/female enrollment at two schools in several different programs.
info = [{school: "ut", program: "compsci", male: 78, female: 22},
{school: "txst", program: "compsci", male: 84, female: 16},
{school: "ut", program: "dmi", male: 0, female: 0},
{school: "txst", program: "dmi", male: 50, female: 50},
{school: "txst", program: "journ", male: 39, female: 61},
{school: "ut", program: "journ", male: 26, female: 74},
];
I have created a function to put the code from plotly in. This is what will be executed when the dropdown changes. I have changed the y values to include variables instead of values, and I changed the names of the x values. To keep the traces grouped, these have to be named exactly the same in both traces. Notice the names and types and the y axis range that was added as well as a statement to suppress the default modebar in Plotly. Once you begin working with an API, you can learn more about the options it provides.
function drawChart() {

//plotly code for two bars
var trace1 = {
x: ['Computer Science', 'Journalism/Ad', 'DMI'],
y: [csmale, journmale, dmimale],
name: 'Male',
type: 'bar'
};

var trace2 = {
x: ['Computer Science', 'Journalism/Ad', 'DMI'],
y: [csfemale, journfemale, dmifemale],
name: 'Female',
type: 'bar'
};

var data = [trace1, trace2];
var layout = {
barmode: 'group',
yaxis: {range: [0, 100]}
};

Plotly.newPlot('myDiv', data, layout, {displayModeBar: false});
}
So, we have our form, data and function, but we need to provide information in the function to tell it how to read the JSON. Include the following code at the top of the drawChart() function. The first line gets the value from the dropdown, as we did in the Quiz example. The for loop traverses the json and the if statements assign the values to variables, depending on what is selected and matched in the JSON. This allows the form to change values based on the dropdown selection.
myschool = document.getElementById("thedropdown").value;
for(i=0;i<info.length; i++){
if(myschool == info[i].school){

if(info[i].program == "compsci"){
csmale = info[i].male;
csfemale = info[i].female;
}

if(info[i].program == "dmi"){
dmimale = info[i].male;
dmifemale = info[i].female;
}

if(info[i].program == "journ"){
journmale = info[i].male;
journfemale = info[i].female;
}
}
}
Run the visualization. If you have problems, use the Chrome Inspector Console to see if it can help you troubleshoot.
We’d really like to have some data when the chart loads, rather than an empty page. Include these variable initializations and initial function call above the function declaration.
var csmale;
var csfemale;
var dmimale;
var dmifemale;
var journmale;
var journfemale;

//initial view of chart
drawChart();
Run the visualization. If you have problems, use the Chrome Inspector Console to see if it can help you troubleshoot. You should be able to see the chart functioning as the example provided here.